The fact that the noise is independent from the optical gain when changed by DARM offest, while it is dependent from the optical gain when changed by SR alignment, could be intuitively done from the fact that the noise is generated in the central area. Infact by alignment of SR the equivalent reflectivity of input mirror is changed: so the behaviour of a phase signal generated in the arm or in the central area could be different?
The unmodelled noise limiting Virgo in the bucket is still unexplained despite several physical mechanisms have been proposed and some ruled out [see wiki].
A possible candidate for mystery noise may be the coupling of the polarization fluctuations of the beam generated in the central interferometer with the (difference of) birefringence of the compensation plates.
The reason for this is that the compensation plates are mounted in a different way with respect to the mirrors and can have stress generated either by the supports on which they are placed or by the lateral screws by which they are tightened.
It is also doubtful whether the machining of the compensation plate, starting from the bulk, has left inner mechanical stress.
Indeed, as regards the compensation plates (to our knowledge), a constraint on birefringence apparently was not requested before the assembly (see for example VIR-0075A-15, VIR-0153A-16, VIR-0380A-14).
The actual amount of residual stress should be simulated from the mounting conditions to evaluate the birefringence. In the bulk of the mirrors, the required value was of the order of dn < 10-7. This limit was reached (and also well surpassed) by the bulks. In the case of a mirror subjected to stress, the value can be higher, even ten times or more, so even if the compensation plates are thinner than the mirror bulk, their effect could be dominant. In this way the difference in polarization angle of the two plates could be up to Psi_0 = 10-2 rad. (Notice that this gives a contribution to contrast defect of 10-4 which is compatible with the requirement made on the mirror bulk)
Another point to evaluate is the birefringence fluctuations for a mirror subjected to stress. In literature, this is very difficult to find (at least for us) and what we found are polarization fluctuations of the order of 10-9 rad/\sqrt(Hz) with a slope of approximately 1\/sqrt(f), but on very different optical substrates. Recent measurements in Virgo give the upper limit dpsi < 10-9 rad/\sqrt(Hz) in the fluctuation of beam polarization in B5 [see wiki]
The way this noise enters the sensitivity is better evaluated not by considering the phase noise of the recombining beams but the power noise at the dark port. Such a calculation shows that this noise depends on the optical gain.
The noise can be calculated as \tilde(P)/Prc = (1/4)Psi_0 \tilde(Psi). where Psi_0 is the angle at the beam splitter recombination, Prc the recycled power, and \tilde(Psi) is its fluctuation.
If we assume as value of Psi_0 and \tilde(Psi) the upper values given above, the resulting noise is compatible with the present sensitivity.
Better investigations are needed.
The fact that the noise is independent from the optical gain when changed by DARM offest, while it is dependent from the optical gain when changed by SR alignment, could be intuitively done from the fact that the noise is generated in the central area. Infact by alignment of SR the equivalent reflectivity of input mirror is changed: so the behaviour of a phase signal generated in the arm or in the central area could be different?
The tiltmeter laser has been removed for analysis. It is planned to verify off line the laser stability, to eventually add a faraday isolator and when possible verify the pick-off efficiency.
We gave a look to some environmental and CO2 laser signals, that we report in figure 1. The temperature of the (air of) the TCS benches is smoothly decreasing; the temperatures of the lasers are fluctuating and the laser powers are fluctuating coherently, by about 1% at highest peak after few hours. The power at the ISSN point is fluctuating of the order of 3%. We checked if these fluctuations were similar to temperature fluctuations of the benches (measured with a thermometer sensing the air temperature) or the chiller temperature but there in no correlation.

The tiltmeter installed in the NEB has been operating in the last month (figure 1) and a first characterization has been performed.
The optical readout scheme is reported in figure 2. NNC_NEB_TILT_ITF is the signal as is read by the interferometer photodiode, while NNC_NEB_TILT_PICKOFF is a pickoff of the input laser power. This latter is used to perform a laser power noise subtraction from the ITF signal, and the normalized signal which accounts for this subtraction is called
NNC_NEB_TILT_ERROR = NNC_NEB_TILT_ITF / NNC_NEB_TILT_PICKOFF.
(Notice that the *_ERROR channel has been added only after few weeks, to see data from earlier periods the signals ERR_PRE/POST can be used. These signals are different between them only when a noise injection is performed).
The tiltmeter signal has been calibrated and a first estimation of the sensitivity has been performed. The calibration factor for the ITF signal has been computed to be 3.8e-7 rad/V. This value can be considered correct within 10%, as it depends on the contrast defect of the readout interferometer signal and on the locking condition- which should be mid-fringe, but the signal could drift in time. A new signal called "NNC_NEB_TILT_ITF_CALI" takes into account this calibration value.
To calibrate the error signal, instead, it is necessary to multiply it by the calibration factor and by the mean value of the pickoff in the considered data stretch.
Some noise injections were performed in order to measure the OLTF and therefore compute the out-of-loop sensitivity from the error signal. In figure 3 the OLTF model superimposed to two noise injection, one perfomed on the left couple of actuators, the second perfomed on the right couple. From this measurement we desume that the two actuators couples perform the same force on the arm.
The OLTF can be modeled as follows (exploiting the "virgo2zpk" function in matlab format [function sys_zpk = virgoZPK(zero_freq,zero_Q,pole_freq,pole_Q,gain@gfreq,gfreq)])
fg = 0.12 %filter gain
H = virgo2zpk(0.01,0.5,[0 0.8],[0 0.707],1,0.1)*fg %filter model
G = virgo2zpk([],[],0.023,270,1,0) %plant model, where 23mHz is the resonance frequency of the system and 270 is the Q as measured in air by Paolo. This latter might be re-measured in vacuum
g = 850; % gain necessary to match the measured TF with the model
OLTF = G.*H*g
In figure 4, the best sensitivity of the tiltmeter during this period is shown. In figure 5, the sensitivity divided by the CLTF.
The tiltmeter shows to be sensitive to different wind condition (speed and direction). However, it is also affected by low frequency noise when a higher correction is applied to the actuators to hold the lock. Figure 6. This aspect will be improved in the next future.


Few points to clarify.
The channel NNC_NEB_TILT_ERROR is given by:
ERROR = (SET - ITF/PICKOFF) * GAIN = ERROR_POST * GAIN
(channel prefix NNC_NEB_TILT omitted for sake of clarity)
where NNC_NEB_TILT_SET is the set point of the error signal, and is needed for the ERROR to oscillate around 0.
The correct way to get the error signal calibrated in radiants is:
ERROR [V/V] * 3.8e-7 [rad/V] * mean(PICKOFF) [V] / GAIN
or, alternatively,
ERROR_PRE(or POST) * 3.8e-7 [rad/V] * mean(PICKOFF) [V]
where 3.8e-7 rad/V is the calibration factor.
From the figures of Capocasa (56652) I argue that the DAS compensation is still off-set with respect ot the beam.

In low frequency, in the region 10-100mHz the actuation noise is decreasing with time. This is consistent with being presently limited by actuation noise because the DC correction is as well slowly and uniformly decreasing with time. At the moment the voltage applied to Electrostatic actuator is 230 V. In figure two curves taken today and two days before. At this rate the DC correction can let decrease without any intervention for few more days until it will reach the interesting zone of few tens of Volts.

Figure 3 and zoomed in 4 shows a plot with the signal of optical lever and ITF superimposed. The optical lever is low passed at around 20 Hz (not corrected in the present superimposition). The noise measured around 10 Hz and below is few 10-10 rad/sqrt(Hz) and it is similar to the same measurement in LIGO at 10 Hz (coughlin et al Phys.Rev.Lett. 121 (2018) no.22, 221104). The optical lever is at its sensitivity limit at this level. For frequency above 13 Hz our spectrum is above 10-9 rad/sqrt(Hz) with interferometer and optical lever reading the same signal. Further investigations are needed to understand if this is an enhancement of the signal due a resonance of the vacuum tank and give a suitable calibration. Above 20 Hz the signal decreases again to 10-10 rad/sqrt(Hz). Finally preliminary coherence plots have been taken with seismometers, figure 5. Below 10 Hz there better coherence with N directed seismometer and above 10 Hz coherence is also on vertical and W directed seismometers.


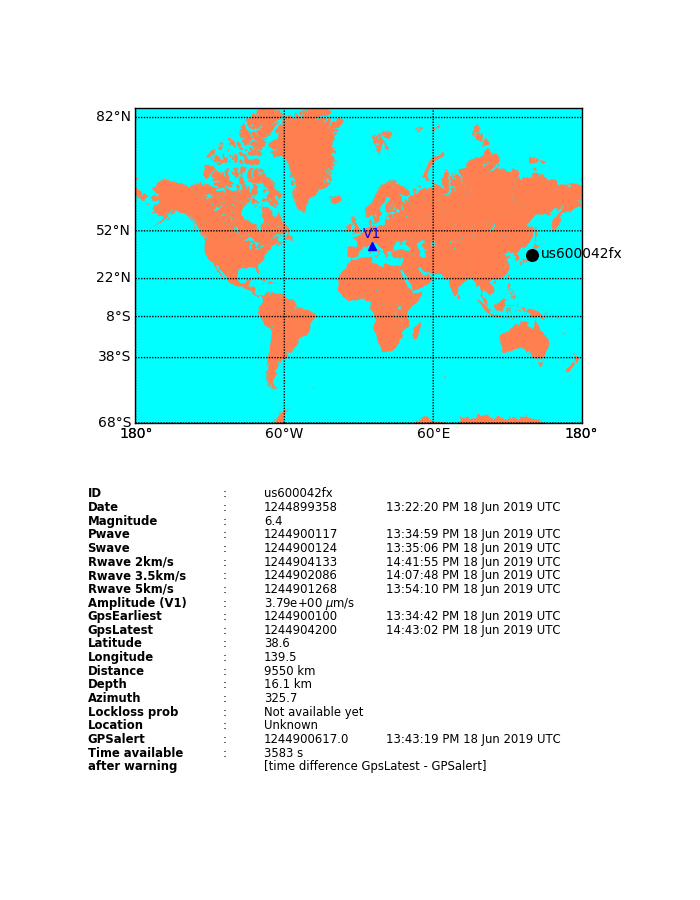
Conclusion: the different reading of the waves by accelerometers and tiltmeter is compatible with the accelerometers/tiltmeter behavior, particularly taking into account that P waves are expected to generate much lower tilts with respect to the others.


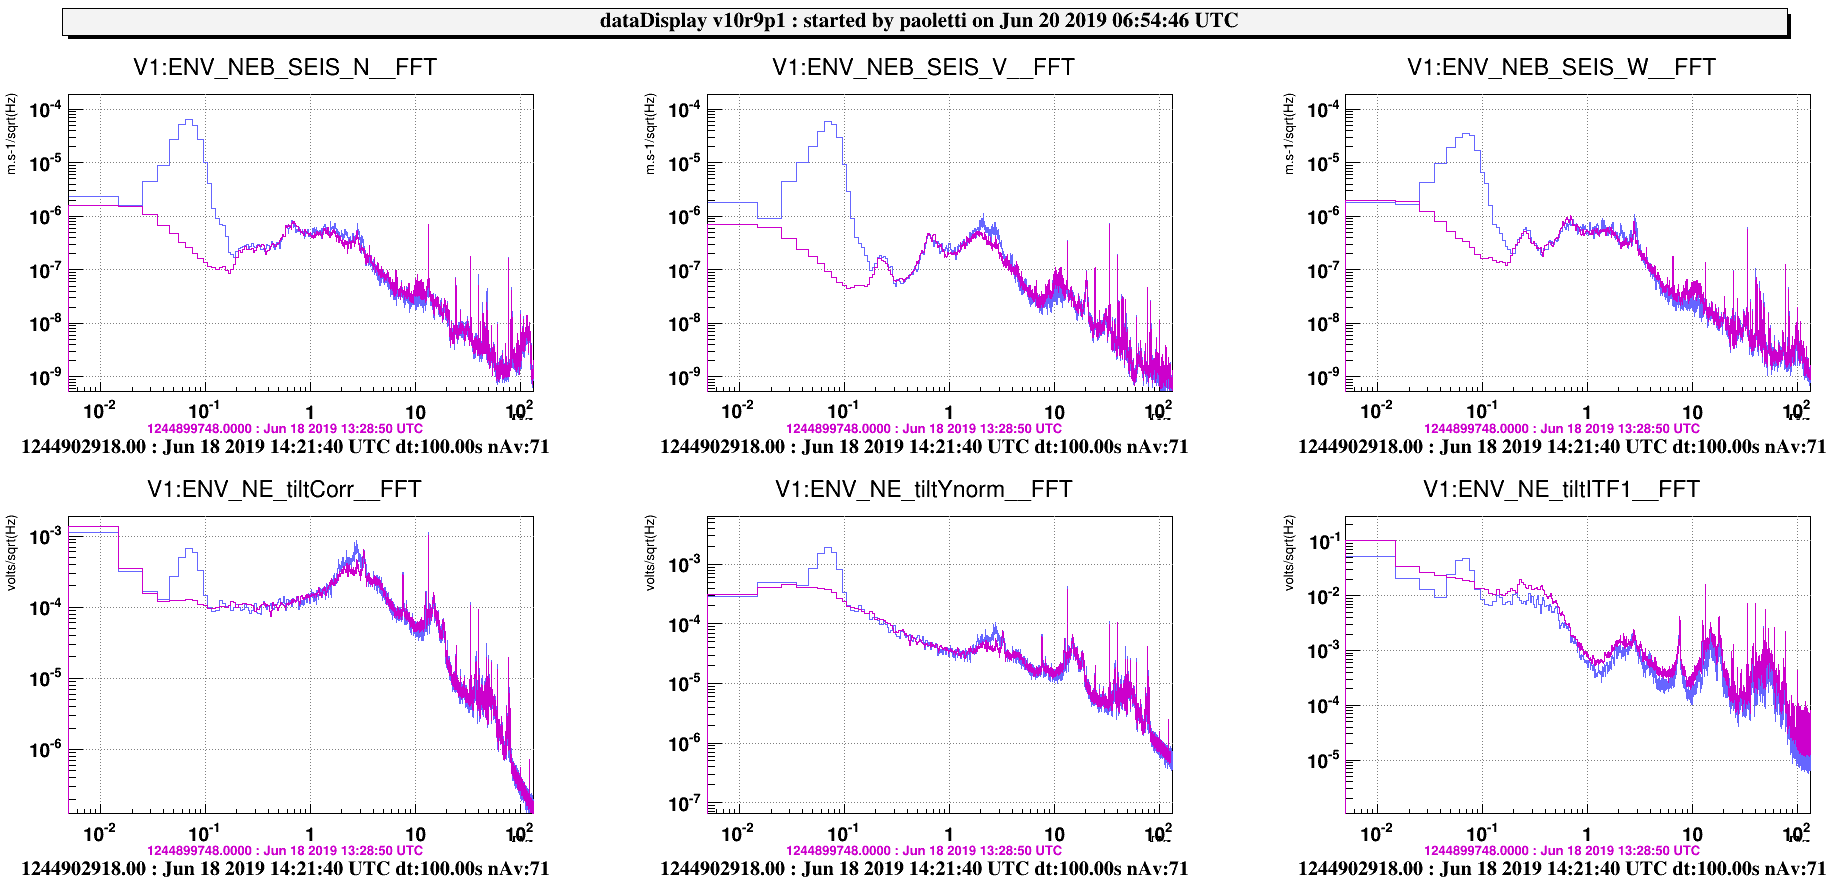
The most useful signals are
1) ENV_NE_tiltYnorm: the error signal of the optical lever.
2) ENV_NE_tiltITF1: the interferometer signal - notice that presently the interferometer is not locked because we want to study the optical lever drift.
3) ENV_NE_tiltCorr: the correction signal sent to electrostatic actuator.
Details on sensitivity, calibration and correlations will follow.
Using a distant earthquake, these are the signals currently seen by NEB seismometers and the NE tiltmeter (FFT and SpectroGrams)


- Installation of a "smart" power stripe for Tiltmeter's electronics. This installation has been done together with the installation of a new ethernet switch by the service group. 2 of the 4 remotely controllable plugs are now used to power the HV amplifier (plug n.3) and the vacuum pump's controller (plug n.4);
- Configuration of the software to control the translational stages by remote (Sentenac);
- Mechanical balancing of the Tiltmeter's arm, so that the optical lever is aligned too and ready to acquire significant data;
In the afternoon we also started to study these signals and settled a first feedback control on the optical lever.
In this moment, the Tiltmeter is in a first science mode, Vacuum is ON, Optical Lever is ON and one HV amplifier is generating around 1000V to close the loop with the electrostatic actuators.

Next step will consist into center the laser beam in output on the quadrant photodiode by moving this one with translational stages. We checked the functioning by remote of these stages and one seems not to work. We will investigate about it.
PZT controller has been momentarily removed from the rack near the tiltmeter because the power entry connector needs to be replaced.
Actually what we installed is a standalone UDSPT board (see attached photo). Analog i/o was connected to tiltmeter front-end electronic. Optical link was connected to mux/demux sn24, ch. 3. Board power supply was connected to Suspension Control System PDU (Port#3). Dictionary data prefix is set to ENV_NE. Tolm packet routing is set to 0xf94c000. We check proper connection of analog i/o. Connection with timing distribution was validated while DAQ connection test is pending (we are now sending 6 signals).

The ENV_NE Tiltmeter channls are correctly received by the SUSP_Fb TolmFrameBuilder since
- 2019-05-14-09h07m56-UTC>INFO...-[TolmFrameBuilderSource::SetUp] New source ENV_NE (v1) with GPS time: 1241860094.000102519
and available on all the data streams (RAW, RAW_FULL,RDS and TREND)

After the intervention on the B4 beam, we had to slightly retune the SSFS gains during the lock acquisition (it was failing at the LOCKED_PRITF state) and re-check the sequence again; we observed a few locks (often ended manually) and everything seems fine. We are now back in Science mode and we'll monitor the ITF behaviour.
The data are shown in MICH offset 0.5.
This behaviour appears in agreement with the better alignment RF error signals (see future entry by Mantovani).
The waist of the sidedands remains different from the carrier one.

We looked at PC images in B4 and B1p at different MICH offset, particularly at MICH_SET = 0.1.
The beam is not centered on B4 PC, so we can just have a very rought indication about sidebands and carrier superposition.
On B1p the shape of the sidebands is quite different from the carrier, and at a first glance, it is not clear if it is due to the different relative phase due to the Schnupp asymmetry with respect to the carrier or it's their actual shape. More investigations will be performed on this side.
Attached are the PC images for B4 (first line) and B1p (second line). In order from left: Carrier, 6MHz_lower, 6MHz_upper, 119MHz_lower, 119MHz_upper.
Figure 1: MICH_SET = 0.7
Figure 2: MICH_SET = 0.5
Figure 3: MICH_SET = 0.4
Figure 4: MICH_SET = 0.2
Figure 5: MICH_SET = 0.1


As suggested by Matteo, we measured the SSFS transfer function with the IB linear alignment turned off. The structures below 100 Hz disappeared. It means that the IB angular control makes a relevant loop on the MC length through the frequency noise seen by the quadrants, amplified by the bench mechanical resonances.
The structure at 156 Hz does not change. In my opinion also that could be related to some resonance at the level of suspended IB, but I have not a guess about the mechanism of coupling.

Yesterday we implemented the idea of engaging SSFS acting step by step on the SSFS loop and on MC loop separately. We worked in recombined half fringe, starting from the CARM to MC configuration, and finally we reached a stable condition with the SSFS loop working with a UGF close to 1 KHz, as we had planned to do.
In Fig. 1 we see the spectrum of CARM in three conditions:
- blue - RFC is locked, the arms are controlled in CARM - DARM configuration with B7 and B8, B4_6MHz is not in loop
- red - CARM is open and B4_6MHz is in loop with MC
- yellow - SSFS is engaged
In Fig. 2 the ideal design of the loop is shown. Ideal means that the model uses a flat TF for SSFS (no strange feature at low frequency), and the SSFS corrector is simply a constant with a roll off a 4 KHz. In the reality the corrector has a lot of strucures wich are supposed to roughly compensate the features of the TF. For that, the behavior of the loop is much worse in the region of the crossing, and it is quite difficult to develop a model which explain well all the criticality. Anyway, a rough model was helpful to understand the action to do to move from the low gain to the full gain configuration.
In Fig. 3 we see the ratio between the spectrum of B4 in CARM to MC and in SSFS config. The superposed curve is the expected suppression of SSFS loop in case of the ideal design. It is interesting to note that in the region where the SSFS loop is dominant the result is well described by the model, if one supposes a total delay of the loop not greater than 80 microsec.


The poles at 4 KHz in the SSFS control filter has been moved to 8 KHz. The result is shown in the plot.

Yesterday we made an SSFS noise injection after the tuning of fModErr (gps 1167490266,200).
All the strange structures in the TF were still there, with significant differences in amplitude and phase.

Yesterday we made again some noise injection on MC loop and SSFS loop, changing the shape of the noise in order to measure the TF below 100 Hz.
Fig.1 (gps 1167380016,200) MC locked on RFC with a smooth control filter
Sc_MC_RFC_Err_Pre over Sc_Mc_RFC_Err_Post (MC open loop TF)
Fig. 2 (gps 1167381616,200) MC locked on RFC with a smooth control filter
SIB2_RFC_6MHz_I over SSFS_corr_RA_10KHz
Fig.3
zoom of Meas #2 around 30 Hz --- not expected features
Fig. 4 (the same injection as #2)
Meas #2 multplied by (1-Meas#1) (SSFS open loop TF)
Fig. 5 (gps 1167392235,200) MC locked on B4 with the standard control filter
Sc_MC_RFC_Err_Pre over Sc_Mc_RFC_Err_Post (MC open loop TF)
Fig. 6 (gps 1167388616,200) MC locked on B4 with the standard control filter
LSC_B4_6MHz_I over SSFS_corr_RA_10KHz
Fig. 7 (gps 1167407086,160) MC locked on B4 with the standard control filter - noise at high frequency
SSFS open loop TF
missing plots


Yesterday we made an SSFS noise injection after the tuning of fModErr (gps 1167490266,200).
All the strange structures in the TF were still there, with significant differences in amplitude and phase.

As suggested by Matteo, we measured the SSFS transfer function with the IB linear alignment turned off. The structures below 100 Hz disappeared. It means that the IB angular control makes a relevant loop on the MC length through the frequency noise seen by the quadrants, amplified by the bench mechanical resonances.
The structure at 156 Hz does not change. In my opinion also that could be related to some resonance at the level of suspended IB, but I have not a guess about the mechanism of coupling.
The transfer function between SSFS_corr and one error signal of the bench automatic alignment is shown in Fig. 1. After few seconds of amazement, kiwamu suggested that such a perfect response could be due to some electronic coupling.
The second plot shows the different effect on the alignment signal if some frequency noise is produced moving the MC mirror (blue curves) or injecting some SSFS_corr.


This is a review of the SSFS loop modeling, attempting to summarize our current understanding.
Punchline:
- In order to explain the 30 Hz instability that people have seen, there has to be some unmodeled feature(s) somewhere in the system.
[Loop model]
I have made up a simple loop model in simulink. This should be effectively the same as what VIR-0013C-12 did. The picture below shows a screen shot of the simulink model.
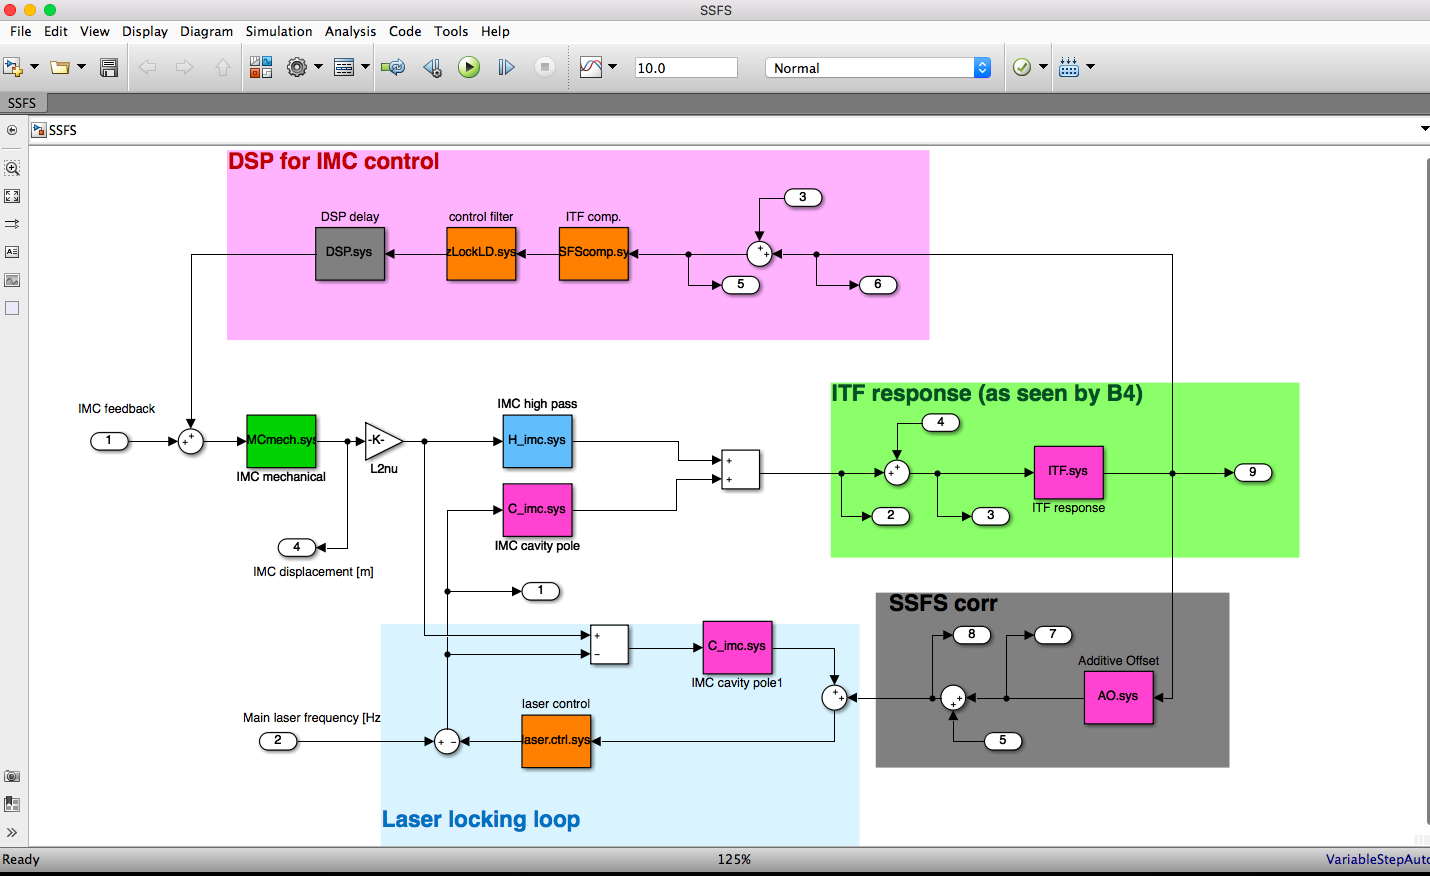
The light blue section in the lower middle represents the laser locking loop, which is modeled with a simple 1/f-ish open loop with a UGF of 200 kHz. The signal is derived by the comparison between IMC's eigen frequency and the laser frequency. The tricky part is, as described in VIR-0013C-12, the laser frequency gets filtered by the IMC cavity pole (450 Hz) as it propagates through the IMC. This filtering effect is given by the pink block in the middle.
The pink section in the upper part represents the DPS control for the IMC mirror position. We have loaded the actual filters that have been used to simulate the actual experiments. The delay is tentatively set to 400 usec which maybe too much. The signal from the DSP is then sent to the IMC suspension (shown as a green block on the left) which has a complex pole at 0.66 Hz with some moderately high Q as the mechanical transfer function. Actuating on the IMC mirror position consequently changes the IMC's eigen frequency. The next tricky part is that the effect of the displacement is then filtered by the high pass (iw/(iw+w0) where w0 is the IMC cavity pole frequency in rad/sec ) because this is essentially a Doppler shift of the intracavity light.
Finally changes in the frequency of the laser light transmitting through the IMC is detected by B4 using the main interferometer as a transducer (shown as a green rectangular section in the middle right). For now, we put a single pole at 55 Hz as the interferometer response. We usually close this loop initially with the IMC path (upper part) and gradually ramp up the SSFS corr (a dark gray section in the lower right). The SSFS corr path is set to flat to simulate the latest test configuration (35764).
And, of course, I had to put many fudge factors everywhere to maintain reasonable UGFs. Also, it is unclear where the exact injection point is for the SSFS corr. For now it is set to the point right after the photo detector so that there is no compensation filter upfront.
[Some simulation]
With this simple model in hand, we made an open loop plot to check out the stability. This is meant to simulate what Paolo and Julia have been testing. Here is the result.

The blue curve is the open loop transfer function without closing the SSFS corr path. The UGF is adjusted to about 200 Hz. The red curve is the open loop transfer function with the SSFS corr only (i.e. without IMC loop). The yellow is the total open loop when both loops are engaged. The gain of the SSFS corr is manually adjusted so that there is some slight loop interaction above 100 Hz. According to Paolo, this configuration is meant to test out the loop models and not meant for a final loop design. In this configuration, there is obviously no crossover frequency point between the two loops.
In the past, people saw an instability at around 30 Hz in this configuration. Looking at the plot above, it is obvious there is no way to have such instabilities at around 30 Hz even though there is some slight bad loop interaction around 30 Hz. This probably means that there has to be a unmodelded feature at around 30 Hz either in the MC length path or the SSFS corr path.

